Gràcia

Property prices in Camp d'en Grassot i Gràcia Nova

The average property sale price in El Camp d'en Grassot i Gràcia Nova neighbourhood is 5,276 €/m², according to provisional 2026 figures published by Barcelona City Council. This average covers recorded transactions from an incomplete year; the value of an individual home depends on its characteristics.

Explore the data
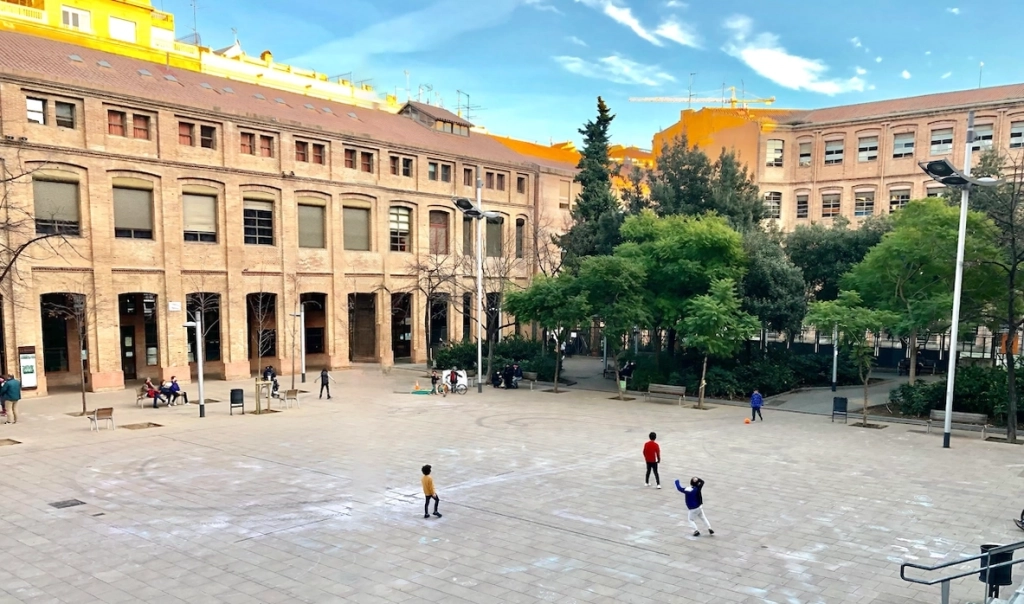
Courtyard of La Sedeta in Camp d’en Grassot i Gràcia Nova

Official data from Barcelona City Council. Each figure includes its reference date so you can distinguish the latest available data from the current year.

01 · The housing market

Neighbourhood prices and property sales

Prices paid in recorded transactions, how prices have changed and the ownership of the existing housing stock.

The property sales market

Four key figures for recorded property sales: price per square metre, number of transactions, average purchase price and floor area of homes sold.

Average sale price per m²

5,031 €/m²

2025 · full year

+16.9% compared with the previous year

Residential property sales

312

2025 · full year

-5.5% compared with the previous year

Average price per home

381,752 €

2025 · full year

+13.1% compared with the previous year

Average area of homes sold

78.5 m²

2025 · full year

-3.3% compared with the previous year

Average sale price per m² over time

Recorded property sales · euros per square metre

3,0003,5004,0004,5005,0005,50020163,00620173,45520184,11220193,88420203,64320213,92120223,95220234,04120244,30520255,031

Scroll the chart to see every year.

Compare with Gràcia and Barcelona

Each row states its full reference year. The same period is used for all three areas.

Indicator / categoryEl Camp d'en Grassot i Gràcia NovaGràciaBarcelona
Average sale price per m²
2025 · full year
5,031 €/m²4,818 €/m²4,254 €/m²
Residential property sales
2025 · full year
3121,14916,897
Average price per home
2025 · full year
381,752 €389,618 €372,930 €
Average area of homes sold
2025 · full year
78.5 m²82.0 m²86.4 m²

Averages from recorded transactions; these are not individual valuations. The floor area refers to the homes sold.

Source: Barcelona City Council · OMD · Notarial records

2025 · full year

Price by construction period

The average price per square metre of homes sold, grouped by construction period. Figures relate to the stated year, rather than an average across the historical series. Open the historical table to follow each group over time.

1900–19194,743 €/m²
1920–19395,161 €/m²
1940–19594,673 €/m²
1960–19795,038 €/m²
1980–19994,838 €/m²
2000–20205,770 €/m²
2020–present6,785 €/m²
Not recorded4,597 €/m²
Compare with Gràcia and Barcelona

2025 · full year · The same period is used for all three areas.

Indicator / categoryEl Camp d'en Grassot i Gràcia NovaGràciaBarcelona
2020–present6,785 €/m²7,177 €/m²5,731 €/m²
2000–20205,770 €/m²4,777 €/m²4,904 €/m²
1980–19994,838 €/m²4,710 €/m²4,373 €/m²
1960–19795,038 €/m²4,667 €/m²3,944 €/m²
1940–19594,673 €/m²4,533 €/m²4,105 €/m²
1920–19395,161 €/m²5,162 €/m²4,772 €/m²
1900–19194,743 €/m²4,992 €/m²4,640 €/m²
Before 1900Not published5,868 €/m²4,308 €/m²
Not recorded4,597 €/m²4,461 €/m²4,278 €/m²

Average sales with at least five observations, restricted to horizontal property. Differences do not isolate the effect of age and are not individual valuations.

View historical data

2021 · full year – 2025 · full year · Most recent first

Category2025 · full year2024 · full year2023 · full year2022 · full year2021 · full year
2020–present6,785 €/m²Not publishedNot publishedNot publishedNot published
2000–20205,770 €/m²4,777 €/m²4,268 €/m²4,250 €/m²4,399 €/m²
1980–19994,838 €/m²4,462 €/m²3,529 €/m²3,997 €/m²3,778 €/m²
1960–19795,038 €/m²4,148 €/m²3,996 €/m²3,826 €/m²3,828 €/m²
1940–19594,673 €/m²4,108 €/m²3,958 €/m²3,928 €/m²4,432 €/m²
1920–19395,161 €/m²4,679 €/m²4,216 €/m²3,991 €/m²3,689 €/m²
1900–19194,743 €/m²4,207 €/m²4,613 €/m²3,954 €/m²3,800 €/m²
Before 1900Not publishedNot publishedNot published4,220 €/m²4,475 €/m²
Not recorded4,597 €/m²4,230 €/m²4,168 €/m²3,924 €/m²3,847 €/m²

Source: Barcelona City Council · OMD

09/03/2026

Registered ownership

The distribution of homes by their first registered cadastral holder: individuals, companies, public bodies and other entities.

“Individual — Spanish nationality” is the largest category, accounting for 83.0% of the total.

87.0 %

of homes have an individual as their first registered cadastral holder.

Compare with Gràcia and Barcelona

09/03/2026 · The same period is used for all three areas. Percentage of each area’s total where the source permits calculation; below, the number of homes.

Indicator / categoryEl Camp d'en Grassot i Gràcia NovaGràciaBarcelona
Individual — Spanish nationality83.0 %15,594 homes79.8 %56,643 homes78.8 %659,066 homes
Individual — foreign nationality4.0 %749 homes4.8 %3,378 homes5.6 %47,005 homes
Public limited company2.0 %367 homes1.9 %1,346 homes2.1 %17,525 homes
Limited liability / civil company9.9 %1,868 homes11.2 %7,929 homes10.0 %83,338 homes
Other companies and associations0.6 %121 homes1.2 %843 homes1.0 %8,237 homes
Foreign entities0.0 %9 homes0.0 %31 homes0.1 %691 homes
Public bodies0.2 %44 homes0.5 %388 homes2.0 %16,387 homes
Religious institutions0.0 %8 homes0.2 %174 homes0.2 %1,534 homes
Other types / joint ventures0.0 %2 homes0.0 %4 homes0.0 %123 homes
Not recorded0.2 %32 homes0.3 %204 homes0.3 %2,715 homes

Based on the first cadastral holder; this does not identify large landlords or how each home is used.

View historical data

01/01/2022 – 09/03/2026 · Most recent first

Category09/03/202604/03/202526/02/202406/03/202301/01/2022
Individual — Spanish nationality15,59415,59415,68815,77315,750
Individual — foreign nationality749714669617559
Public limited company367367370361367
Limited liability / civil company1,8681,8851,8141,7391,758
Other companies and associations121136122135118
Foreign entities98998
Public bodies4421212121
Religious institutions87766
Other types / joint ventures22223
Not recorded32353736101

Source: Barcelona City Council · OMD · Cadastre / property tax

02 · The housing stock

Homes in the neighbourhood

Floor areas, construction periods and the number of homes. A picture of the housing stock that puts your own property in context.

09/03/2026

How does your home compare in size?

Compare your home’s floor area with the sizes found in the neighbourhood and see what share each range represents.

“61–90 m²” is the largest category, accounting for 53.0% of the total.

<30 m²2.1 %388 homes
31–60 m²24.1 %4,521 homes
61–90 m²53.0 %9,952 homes
91–120 m²15.9 %2,993 homes
121–150 m²4.0 %754 homes
151–210 m²0.8 %146 homes
211–250 m²0.1 %17 homes
>250 m²0.1 %23 homes
Compare with Gràcia and Barcelona

09/03/2026 · The same period is used for all three areas. Percentage of each area’s total where the source permits calculation; below, the number of homes.

Indicator / categoryEl Camp d'en Grassot i Gràcia NovaGràciaBarcelona
<30 m²2.1 %388 homes4.1 %2,893 homes3.0 %25,014 homes
31–60 m²24.1 %4,521 homes28.8 %20,408 homes27.2 %227,392 homes
61–90 m²53.0 %9,952 homes46.0 %32,612 homes46.0 %384,437 homes
91–120 m²15.9 %2,993 homes15.0 %10,654 homes15.6 %130,240 homes
121–150 m²4.0 %754 homes3.9 %2,737 homes4.4 %36,538 homes
151–210 m²0.8 %146 homes1.8 %1,280 homes2.9 %24,203 homes
211–250 m²0.1 %17 homes0.3 %206 homes0.6 %4,719 homes
>250 m²0.1 %23 homes0.2 %150 homes0.5 %4,078 homes

Existing cadastral housing stock; these are not current listings.

View historical data

01/01/2022 – 09/03/2026 · Most recent first

Category09/03/202604/03/202526/02/202406/03/202301/01/2022
<30 m²388394382381381
31–60 m²4,5214,5044,4884,4914,506
61–90 m²9,9529,9409,9299,9069,878
91–120 m²2,9932,9862,9882,9692,974
121–150 m²754759760758757
151–210 m²146146149149151
211–250 m²1717191919
>250 m²2323242625

Source: Barcelona City Council · OMD · Cadastre / property tax

09/03/2026

When the homes were built

See how homes are distributed by construction year and which periods account for the largest share of the housing stock.

“1971–1980” is the largest category, accounting for 27.1% of the total.

Percentage above each bar · Number of homes below each period
2.1 %<1901404
21.0 %1901–19403,955
4.6 %1941–1950862
6.4 %1951–19601,207
23.3 %1961–19704,381
27.1 %1971–19805,091
4.4 %1981–1990827
4.4 %1991–2000827
3.5 %2001–2010656
2.2 %2011–2020412
0.9 %2021–2030172
Scroll the chart to see every period.
Compare with Gràcia and Barcelona

09/03/2026 · The same period is used for all three areas. Percentage of each area’s total where the source permits calculation; below, the number of homes.

Indicator / categoryEl Camp d'en Grassot i Gràcia NovaGràciaBarcelona
<19012.1 %404 homes11.1 %7,848 homes9.5 %79,125 homes
1901–194021.0 %3,955 homes21.4 %15,183 homes14.2 %118,546 homes
1941–19504.6 %862 homes3.9 %2,743 homes3.0 %24,697 homes
1951–19606.4 %1,207 homes7.6 %5,387 homes9.4 %78,578 homes
1961–197023.3 %4,381 homes20.7 %14,681 homes24.9 %208,397 homes
1971–198027.1 %5,091 homes21.8 %15,499 homes20.6 %171,941 homes
1981–19904.4 %827 homes3.5 %2,514 homes4.7 %39,394 homes
1991–20004.4 %827 homes3.5 %2,482 homes5.0 %41,970 homes
2001–20103.5 %656 homes3.8 %2,711 homes5.6 %46,677 homes
2011–20202.2 %412 homes1.8 %1,279 homes2.0 %16,530 homes
2021–20300.9 %172 homes0.9 %613 homes1.3 %10,766 homes

Building age does not indicate condition or renovation history.

View historical data

01/01/2022 – 09/03/2026 · Most recent first

Category09/03/202604/03/202526/02/202406/03/202301/01/2022
<1901404412411411434
1901–19403,9553,9703,9693,9793,983
1941–1950862862863863866
1951–19601,2071,2051,2041,2031,211
1961–19704,3814,3954,4014,4054,406
1971–19805,0915,0885,0925,0985,098
1981–1990827827830830830
1991–2000827827827827829
2001–2010656655653653652
2011–2020412411409408382
2021–20301721178022Not published

Source: Barcelona City Council · OMD · Cadastre / property tax

09/03/2026

Average size of existing homes

The average floor area of homes in the cadastre, compared with the district and Barcelona as a whole.

The change from the previous annual edition is below 0.1%.

75.5 m²

Compare with Gràcia and Barcelona

09/03/2026 · The same period is used for all three areas.

El Camp d'en Grassot i Gràcia Nova75.5 m²
Gràcia74.0 m²
Barcelona77.9 m²

Existing cadastral housing stock; these are not current listings.

View historical data

01/01/2022 – 09/03/2026 · Most recent first

DateValue
09/03/202675.5 m²
04/03/202575.5 m²
26/02/202475.6 m²
06/03/202375.6 m²
01/01/202275.6 m²

Source: Barcelona City Council · OMD · Cadastre / property tax

09/03/2026

Average age of homes

The average age of the housing stock, calculated from construction years. Compare the neighbourhood with its district and the city.

Change from the previous annual edition: +1.2%.

63.2 years

Compare with Gràcia and Barcelona

09/03/2026 · The same period is used for all three areas.

El Camp d'en Grassot i Gràcia Nova63.2 years
Gràcia71.4 years
Barcelona66.5 years

Building age does not indicate condition or renovation history.

View historical data

01/01/2022 – 09/03/2026 · Most recent first

DateValue
09/03/202663.2 years
04/03/202562.4 years
26/02/202461.5 years
06/03/202360.7 years
01/01/202260.0 years

Source: Barcelona City Council · OMD · Cadastre / property tax

09/03/2026

Homes in the neighbourhood

The number of homes recorded in the cadastre. Explore the trend and compare it with totals for the district and Barcelona.

Change from the previous annual edition: +0.1%.

18,794

Compare with Gràcia and Barcelona

09/03/2026 · The same period is used for all three areas.

Indicator / categoryEl Camp d'en Grassot i Gràcia NovaGràciaBarcelona
Homes in the neighbourhood18,79470,940836,621

Existing cadastral housing stock; these are not current listings.

View historical data

01/01/2022 – 09/03/2026 · Most recent first

DateValue
09/03/202618,794
04/03/202518,769
26/02/202418,739
06/03/202318,699
01/01/202218,691

Source: Barcelona City Council · OMD · Cadastre / property tax

03 · Life in the neighbourhood

Households, residents and disposable income

Household composition and residents’ economic context, with comparisons between areas where the data allow.

01/01/2026

People registered at each address

The distribution of neighbourhood households by the number of people registered at each address.

“One person” is the largest category, accounting for 34.8% of the total.

One person34.8 %5,349 households
Two people30.6 %4,704 households
Three people17.3 %2,664 households
Four people11.8 %1,807 households
Five people3.5 %545 households
Six people1.1 %164 households
Seven people0.4 %69 households
Eight people0.2 %33 households
Nine or more people0.3 %39 households
Compare with Gràcia and Barcelona

01/01/2026 · The same period is used for all three areas. Percentage of each area’s total where the source permits calculation; below, the number of households.

Indicator / categoryEl Camp d'en Grassot i Gràcia NovaGràciaBarcelona
One person34.8 %5,349 households35.7 %19,511 households31.9 %218,433 households
Two people30.6 %4,704 households30.0 %16,394 households29.5 %201,690 households
Three people17.3 %2,664 households16.8 %9,191 households17.6 %120,498 households
Four people11.8 %1,807 households11.8 %6,433 households12.7 %86,631 households
Five people3.5 %545 households3.5 %1,899 households4.4 %30,379 households
Six people1.1 %164 households1.1 %624 households1.8 %12,508 households
Seven people0.4 %69 households0.5 %284 households0.9 %6,005 households
Eight people0.2 %33 households0.2 %128 households0.5 %3,256 households
Nine or more people0.3 %39 households0.4 %224 households0.7 %4,677 households

Municipal register addresses. These figures describe residents, not buyers.

View historical data

01/01/2022 – 01/01/2026 · Most recent first

Category01/01/202601/01/202501/01/202401/01/202301/01/2022
One person5,3495,1775,1775,1345,024
Two people4,7044,7204,6914,5984,534
Three people2,6642,6592,6592,6032,645
Four people1,8071,8681,8671,8811,895
Five people545527528491516
Six people164174151161149
Seven people6971715867
Eight people3341303428
Nine or more people3945292323

Source: Barcelona City Council · OMD · Municipal population register

01/01/2026

Children registered at each address

The distribution of households by the number of registered residents under 18. The chart separates households with children from those without.

“No one under 18” is the largest category, accounting for 81.5% of the total.

18.5% of addresses have at least one registered resident under 18.

18.5 %with children

With residents under 18

Without residents under 18

Compare with Gràcia and Barcelona

01/01/2026 · The same period is used for all three areas. Percentage of each area’s total where the source permits calculation; below, the number of households.

Indicator / categoryEl Camp d'en Grassot i Gràcia NovaGràciaBarcelona
No one under 1881.5 %12,536 households80.6 %44,104 households78.6 %538,014 households
One person under 1810.7 %1,644 households11.2 %6,129 households12.1 %82,743 households
Two people under 186.8 %1,051 households7.0 %3,806 households7.4 %50,744 households
Three people under 180.8 %121 households1.0 %538 households1.4 %9,886 households
Four or more people under 180.1 %22 households0.2 %111 households0.4 %2,690 households

Municipal register addresses. These figures describe residents, not buyers.

View historical data

01/01/2022 – 01/01/2026 · Most recent first

Category01/01/202601/01/202501/01/202401/01/202301/01/2022
No one under 1812,53612,38512,29212,06811,907
One person under 181,6441,6681,6861,6421,665
Two people under 181,0511,0901,0801,1251,155
Three people under 18121120125130132
Four or more people under 182219201822

Source: Barcelona City Council · OMD · Municipal population register

01/01/2026

Registered households

The number of addresses with registered residents. One address may be home to one or more people; this differs from the total number of homes in the cadastre.

Change from the previous annual edition: +0.6%.

15,374

Compare with Gràcia and Barcelona

01/01/2026 · The same period is used for all three areas.

Indicator / categoryEl Camp d'en Grassot i Gràcia NovaGràciaBarcelona
Registered households15,37454,688684,077

Municipal register addresses. These figures describe residents, not buyers.

View historical data

01/01/2022 – 01/01/2026 · Most recent first

DateValue
01/01/202615,374
01/01/202515,282
01/01/202415,203
01/01/202314,983
01/01/202214,881

Source: Barcelona City Council · OMD · Municipal population register

2023

Disposable income per resident

Annual disposable income per neighbourhood resident, compared with the district and Barcelona for the same year.

Change from the previous annual edition: +11.2%.

28,599 €

Compare with Gràcia and Barcelona

2023 · The same period is used for all three areas.

El Camp d'en Grassot i Gràcia Nova28,599 €
Gràcia28,530 €
Barcelona26,069 €

Annual disposable income per resident. This is not a salary or buyers’ budget.

View historical data

2019 – 2023 · Most recent first

DateValue
202328,599 €
202225,713 €
202124,736 €
202023,447 €
201925,219 €

Source: Barcelona City Council · OMD

04 · Camp d’en Grassot i Gràcia Nova

From farmland to the neighbourhood of La Sedeta

Former estates and industrial buildings reveal how this part of Gràcia took shape.

From agricultural land to urban streets

Development of Camp d’en Grassot began around 1860 on former agricultural land. Its name recalls the Grassot family, associated with that transformation. The meeting of Gràcia’s streets and the Eixample grid remains useful context for understanding the neighbourhood. Historical source: Ajuntament de Barcelona · Camp d’en Grassot.

La Sedeta: industrial memory and community life

The Pujol i Casacuberta textile factory, known as La Sedeta, began operating in 1899. Reusing the site for education, culture and community facilities preserved part of the neighbourhood’s industrial heritage. Its buildings still connect that history with the surrounding residential streets. Historical source: Memòria històrica de la Sedeta.

How to interpret an apartment’s price here

The neighbourhood average covers different buildings and homes. Compare a similar location, property type and condition: orientation, floor level, lift access, outdoor space and layout can explain differences between nearby apartments. A visit helps identify what an average price per square metre cannot show.

Historic map of Camp d’en Grassot

Map recovered from PUNTO HABITAT’s media collection. The retained file does not identify its date or author.

05 · Sources and methodology

What these
figures tell us

A useful comparison starts with understanding what each figure measures. Open the historical tables and read the notes accompanying each indicator.

Are these asking prices or recorded sale prices?

The market section uses averages from recorded transactions, based on notarial statistics published by the City Council. These differ from the asking prices shown on property portals.

Why do the reference dates differ?

Sales, cadastral, population register and income data are released on different schedules. Each section shows its reference period. Viewing this page today does not mean all indicators relate to the same year.

Does the average floor area cover all homes?

The sales section measures the homes that were sold. The housing stock section measures homes recorded in the cadastre. These are different populations, so their averages can differ.

What do “Suppressed” and “Not published” mean?

“Suppressed” means the source withholds the information to protect confidentiality. “Not published” means no value is available for the category and period shown. Neither expression means zero.

Can I value my home using the price per m²?

The neighbourhood average is a general reference. An individual valuation requires an assessment of the exact location, floor area, floor level, lift, natural light, condition and building characteristics, together with suitable comparable properties.

Visit us at Espai Sant Joan

You can drop in without an appointment to discuss your property, ask questions and arrange an in-person valuation. We help you sell homes throughout Barcelona.

From the neighbourhood to your home

How much could
your home be worth?

Once you have explored the neighbourhood data, the next step is to look at your own property. Choose how you would like to start.

Compare listings

Compare