L'Eixample

Property prices in la Nova Esquerra de l'Eixample

Sale prices, market trends and an in-depth look at the neighbourhood’s homes and households.

Explore the data
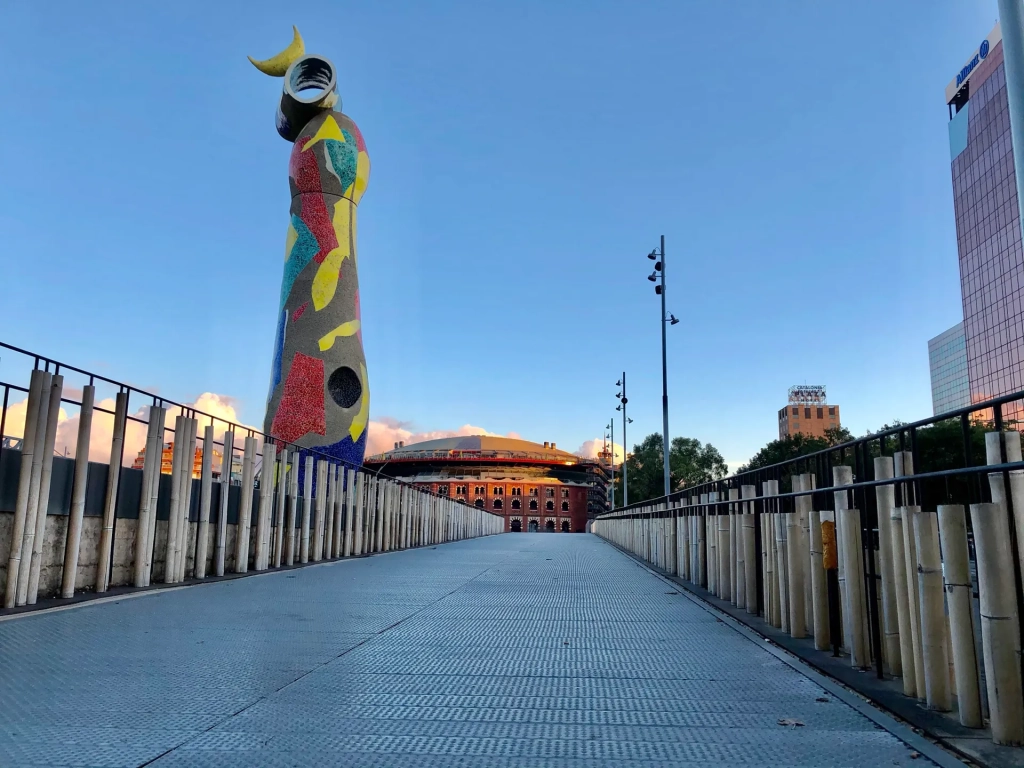
Parc de Joan Miró in the Nova Esquerra de l’Eixample

Official data from Barcelona City Council. Each figure includes its reference date so you can distinguish the latest available data from the current year.

01 · The housing market

Neighbourhood prices and property sales

Prices paid in recorded transactions, how prices have changed and the ownership of the existing housing stock.

The property sales market

Four key figures for recorded property sales: price per square metre, number of transactions, average purchase price and floor area of homes sold.

Average sale price per m²

5,211 €/m²

2025 · full year

+15.6% compared with the previous year

Residential property sales

605

2025 · full year

+15.2% compared with the previous year

Average price per home

432,049 €

2025 · full year

+11.6% compared with the previous year

Average area of homes sold

86.2 m²

2025 · full year

-3.5% compared with the previous year

Average sale price per m² over time

Recorded property sales · euros per square metre

3,5004,0004,5005,0005,5003,77620203,86320214,12720224,29520234,50820245,2112025

Scroll the chart to see every year.

Compare with L'Eixample and Barcelona

Each row states its full reference year. The same period is used for all three areas.

Indicator / categoryla Nova Esquerra de l'EixampleL'EixampleBarcelona
Average sale price per m²
2025 · full year
5,211 €/m²5,323 €/m²4,254 €/m²
Residential property sales
2025 · full year
6052,74016,897
Average price per home
2025 · full year
432,049 €516,080 €372,930 €
Average area of homes sold
2025 · full year
86.2 m²98.6 m²86.4 m²

Averages from recorded transactions; these are not individual valuations. The floor area refers to the homes sold.

Source: Barcelona City Council · OMD · Notarial records
2025 · full year

Price by construction period

The average price per square metre of homes sold, grouped by construction period. Figures relate to the stated year, rather than an average across the historical series. Open the historical table to follow each group over time.

1900–19194,904 €/m²
1920–19394,963 €/m²
1940–19594,902 €/m²
1960–19795,018 €/m²
1980–19995,039 €/m²
2000–20206,259 €/m²
2020–present8,113 €/m²
Not recorded4,545 €/m²
Compare with L'Eixample and Barcelona

2025 · full year · The same period is used for all three areas.

Indicator / categoryla Nova Esquerra de l'EixampleL'EixampleBarcelona
2020–present8,113 €/m²7,872 €/m²5,731 €/m²
2000–20206,259 €/m²6,320 €/m²4,904 €/m²
1980–19995,039 €/m²5,217 €/m²4,373 €/m²
1960–19795,018 €/m²4,968 €/m²3,944 €/m²
1940–19594,902 €/m²4,836 €/m²4,105 €/m²
1920–19394,963 €/m²5,355 €/m²4,772 €/m²
1900–19194,904 €/m²5,486 €/m²4,640 €/m²
Before 1900Not published5,833 €/m²4,308 €/m²
Not recorded4,545 €/m²4,706 €/m²4,278 €/m²

Average sales with at least five observations, restricted to horizontal property. Differences do not isolate the effect of age and are not individual valuations.

View historical data

2021 · full year – 2025 · full year · Most recent first

Category2025 · full year2024 · full year2023 · full year2022 · full year2021 · full year
2020–present8,113 €/m²Not published4,378 €/m²Not publishedNot published
2000–20206,259 €/m²5,384 €/m²5,599 €/m²4,739 €/m²4,177 €/m²
1980–19995,039 €/m²4,034 €/m²5,196 €/m²4,067 €/m²3,771 €/m²
1960–19795,018 €/m²4,622 €/m²4,150 €/m²4,273 €/m²3,835 €/m²
1940–19594,902 €/m²4,495 €/m²4,346 €/m²3,903 €/m²3,740 €/m²
1920–19394,963 €/m²4,488 €/m²4,085 €/m²3,997 €/m²3,896 €/m²
1900–19194,904 €/m²4,201 €/m²4,417 €/m²3,870 €/m²3,823 €/m²
Not recorded4,545 €/m²4,468 €/m²4,019 €/m²3,720 €/m²4,242 €/m²

Source: Barcelona City Council · OMD

09/03/2026

Registered ownership

The distribution of homes by their first registered cadastral holder: individuals, companies, public bodies and other entities.

“Individual — Spanish nationality” is the largest category, accounting for 80.1% of the total.

84.4 %

of homes have an individual as their first registered cadastral holder.

Compare with L'Eixample and Barcelona

09/03/2026 · The same period is used for all three areas. Percentage of each area’s total where the source permits calculation; below, the number of homes.

Indicator / categoryla Nova Esquerra de l'EixampleL'EixampleBarcelona
Individual — Spanish nationality80.1 %24,402 homes73.4 %107,044 homes78.8 %659,066 homes
Individual — foreign nationality4.4 %1,331 homes6.3 %9,250 homes5.6 %47,005 homes
Public limited company2.7 %822 homes3.5 %5,032 homes2.1 %17,525 homes
Limited liability / civil company10.8 %3,279 homes13.9 %20,215 homes10.0 %83,338 homes
Other companies and associations1.0 %299 homes1.6 %2,344 homes1.0 %8,237 homes
Foreign entities0.0 %13 homes0.1 %138 homes0.1 %691 homes
Public bodies0.7 %210 homes0.6 %920 homes2.0 %16,387 homes
Religious institutions0.2 %46 homes0.3 %399 homes0.2 %1,534 homes
Other types / joint ventures0.0 %1 homes0.0 %5 homes0.0 %123 homes
Not recorded0.2 %72 homes0.3 %474 homes0.3 %2,715 homes

Based on the first cadastral holder; this does not identify large landlords or how each home is used.

View historical data

01/01/2022 – 09/03/2026 · Most recent first

Category09/03/202604/03/202526/02/202406/03/202301/01/2022
Individual — Spanish nationality24,40224,41624,53224,57324,748
Individual — foreign nationality1,3311,2611,1631,090974
Public limited company822832869884856
Limited liability / civil company3,2793,3193,1503,1462,934
Other companies and associations299279264261281
Foreign entities1314121111
Public bodies210164163152143
Religious institutions4648484849
Other types / joint ventures11111
Not recorded7276120127233

Source: Barcelona City Council · OMD · Cadastre / property tax

The neighbourhood within the Eixample

Compare recorded sale prices across all six neighbourhoods for the same full year. Select a neighbourhood to highlight it.

2025 · full year · €/m²

Dreta del’EixampleAntigaEsquerraNovaEsquerraFort PiencSagradaFamíliaSant Antoni
Darker shades: higher average prices.
View study
View study
View study
View study
View study
View study

La Nova Esquerra de l’EixampleLatest annual figure published: 2026 · partial data · 5,311 €/m². This is a provisional reference and is not directly compared with a full year.View study: La Nova Esquerra de l’Eixample

Prices: Barcelona Dades · OMD / Consejo General del Notariado. Transaction averages, not individual valuations. Neighbourhood boundaries: Barcelona City Council · CC BY 4.0.

02 · The housing stock

Homes in the neighbourhood

Floor areas, construction periods and the number of homes. A picture of the housing stock that puts your own property in context.

09/03/2026

How does your home compare in size?

Compare your home’s floor area with the sizes found in the neighbourhood and see what share each range represents.

“61–90 m²” is the largest category, accounting for 47.7% of the total.

<30 m²1.5 %448 homes
31–60 m²17.1 %5,199 homes
61–90 m²47.7 %14,532 homes
91–120 m²27.4 %8,360 homes
121–150 m²4.6 %1,395 homes
151–210 m²1.6 %502 homes
211–250 m²0.1 %31 homes
>250 m²0.0 %8 homes
Compare with L'Eixample and Barcelona

09/03/2026 · The same period is used for all three areas. Percentage of each area’s total where the source permits calculation; below, the number of homes.

Indicator / categoryla Nova Esquerra de l'EixampleL'EixampleBarcelona
<30 m²1.5 %448 homes1.7 %2,544 homes3.0 %25,014 homes
31–60 m²17.1 %5,199 homes17.4 %25,396 homes27.2 %227,392 homes
61–90 m²47.7 %14,532 homes43.9 %64,036 homes46.0 %384,437 homes
91–120 m²27.4 %8,360 homes23.6 %34,434 homes15.6 %130,240 homes
121–150 m²4.6 %1,395 homes7.2 %10,453 homes4.4 %36,538 homes
151–210 m²1.6 %502 homes4.6 %6,697 homes2.9 %24,203 homes
211–250 m²0.1 %31 homes0.9 %1,296 homes0.6 %4,719 homes
>250 m²0.0 %8 homes0.7 %965 homes0.5 %4,078 homes

Existing cadastral housing stock; these are not current listings.

View historical data

01/01/2022 – 09/03/2026 · Most recent first

Category09/03/202604/03/202526/02/202406/03/202301/01/2022
<30 m²448447469458457
31–60 m²5,1995,1635,1445,1405,124
61–90 m²14,53214,50314,43814,42714,391
91–120 m²8,3608,3628,3398,3248,326
121–150 m²1,3951,3951,3941,4041,405
151–210 m²502501499501500
211–250 m²3131313119
>250 m²88888

Source: Barcelona City Council · OMD · Cadastre / property tax

09/03/2026

When the homes were built

See how homes are distributed by construction year and which periods account for the largest share of the housing stock.

“1901–1940” is the largest category, accounting for 28.5% of the total.

Percentage above each bar · Number of homes below each period
3.8 %<19011,168
28.5 %1901–19408,686
3.8 %1941–19501,170
4.5 %1951–19601,384
18.3 %1961–19705,567
25.7 %1971–19807,837
7.0 %1981–19902,137
3.4 %1991–20001,038
3.2 %2001–2010960
1.2 %2011–2020352
0.6 %2021–2030176
Scroll the chart to see every period.
Compare with L'Eixample and Barcelona

09/03/2026 · The same period is used for all three areas. Percentage of each area’s total where the source permits calculation; below, the number of homes.

Indicator / categoryla Nova Esquerra de l'EixampleL'EixampleBarcelona
<19013.8 %1,168 homes14.8 %21,511 homes9.5 %79,125 homes
1901–194028.5 %8,686 homes27.1 %39,553 homes14.2 %118,546 homes
1941–19503.8 %1,170 homes3.5 %5,114 homes3.0 %24,697 homes
1951–19604.5 %1,384 homes6.5 %9,414 homes9.4 %78,578 homes
1961–197018.3 %5,567 homes17.1 %24,982 homes24.9 %208,397 homes
1971–198025.7 %7,837 homes17.3 %25,173 homes20.6 %171,941 homes
1981–19907.0 %2,137 homes4.7 %6,882 homes4.7 %39,394 homes
1991–20003.4 %1,038 homes3.5 %5,077 homes5.0 %41,970 homes
2001–20103.2 %960 homes3.1 %4,489 homes5.6 %46,677 homes
2011–20201.2 %352 homes1.5 %2,177 homes2.0 %16,530 homes
2021–20300.6 %176 homes1.0 %1,449 homes1.3 %10,766 homes

Building age does not indicate condition or renovation history.

View historical data

01/01/2022 – 09/03/2026 · Most recent first

Category09/03/202604/03/202526/02/202406/03/202301/01/2022
<19011,1681,1771,1771,1661,166
1901–19408,6868,6808,6808,6928,681
1941–19501,1701,1701,1701,1691,174
1951–19601,3841,3841,3831,4131,413
1961–19705,5675,5645,5835,5765,576
1971–19807,8377,8377,8317,7967,794
1981–19902,1372,1362,1362,1352,129
1991–20001,0381,0381,0421,0391,038
2001–2010960960960956956
2011–2020352336300300300
2021–203017612860513

Source: Barcelona City Council · OMD · Cadastre / property tax

09/03/2026

Average size of existing homes

The average floor area of homes in the cadastre, compared with the district and Barcelona as a whole.

Change from the previous annual edition: -0.1%.

81.9 m²

Compare with L'Eixample and Barcelona

09/03/2026 · The same period is used for all three areas.

la Nova Esquerra de l'Eixample81.9 m²
L'Eixample88.2 m²
Barcelona77.9 m²

Existing cadastral housing stock; these are not current listings.

View historical data

01/01/2022 – 09/03/2026 · Most recent first

DateValue
09/03/202681.9 m²
04/03/202581.9 m²
26/02/202481.9 m²
06/03/202381.9 m²
01/01/202281.9 m²

Source: Barcelona City Council · OMD · Cadastre / property tax

09/03/2026

Average age of homes

The average age of the housing stock, calculated from construction years. Compare the neighbourhood with its district and the city.

Change from the previous annual edition: +1.3%.

68.1 years

Compare with L'Eixample and Barcelona

09/03/2026 · The same period is used for all three areas.

la Nova Esquerra de l'Eixample68.1 years
L'Eixample76.6 years
Barcelona66.5 years

Building age does not indicate condition or renovation history.

View historical data

01/01/2022 – 09/03/2026 · Most recent first

DateValue
09/03/202668.1 years
04/03/202567.3 years
26/02/202466.5 years
06/03/202365.5 years
01/01/202264.6 years

Source: Barcelona City Council · OMD · Cadastre / property tax

09/03/2026

Homes in the neighbourhood

The number of homes recorded in the cadastre. Explore the trend and compare it with totals for the district and Barcelona.

Change from the previous annual edition: +0.2%.

30,475

Compare with L'Eixample and Barcelona

09/03/2026 · The same period is used for all three areas.

Indicator / categoryla Nova Esquerra de l'EixampleL'EixampleBarcelona
Homes in the neighbourhood30,475145,821836,621

Existing cadastral housing stock; these are not current listings.

View historical data

01/01/2022 – 09/03/2026 · Most recent first

DateValue
09/03/202630,475
04/03/202530,410
26/02/202430,322
06/03/202330,293
01/01/202230,230

Source: Barcelona City Council · OMD · Cadastre / property tax

03 · Life in the neighbourhood

Households, residents and disposable income

Household composition and residents’ economic context, with comparisons between areas where the data allow.

01/01/2026

People registered at each address

The distribution of neighbourhood households by the number of people registered at each address.

“One person” is the largest category, accounting for 33.8% of the total.

One person33.8 %8,540 households
Two people30.7 %7,765 households
Three people17.2 %4,356 households
Four people11.5 %2,908 households
Five people3.6 %909 households
Six people1.6 %394 households
Seven people0.7 %180 households
Eight people0.3 %84 households
Nine or more people0.5 %136 households
Compare with L'Eixample and Barcelona

01/01/2026 · The same period is used for all three areas. Percentage of each area’s total where the source permits calculation; below, the number of households.

Indicator / categoryla Nova Esquerra de l'EixampleL'EixampleBarcelona
One person33.8 %8,540 households34.2 %39,345 households31.9 %218,433 households
Two people30.7 %7,765 households30.0 %34,566 households29.5 %201,690 households
Three people17.2 %4,356 households16.9 %19,456 households17.6 %120,498 households
Four people11.5 %2,908 households11.6 %13,308 households12.7 %86,631 households
Five people3.6 %909 households3.9 %4,476 households4.4 %30,379 households
Six people1.6 %394 households1.6 %1,872 households1.8 %12,508 households
Seven people0.7 %180 households0.8 %896 households0.9 %6,005 households
Eight people0.3 %84 households0.4 %472 households0.5 %3,256 households
Nine or more people0.5 %136 households0.6 %684 households0.7 %4,677 households

Municipal register addresses. These figures describe residents, not buyers.

View historical data

01/01/2022 – 01/01/2026 · Most recent first

Category01/01/202601/01/202501/01/202401/01/202301/01/2022
One person8,5408,4368,4138,4358,324
Two people7,7657,7247,6547,5467,419
Three people4,3564,3514,3214,3354,343
Four people2,9082,9722,9602,9382,971
Five people909932950939963
Six people394374370348346
Seven people180175164122127
Eight people8486706973
Nine or more people1361289810381

Source: Barcelona City Council · OMD · Municipal population register

01/01/2026

Children registered at each address

The distribution of households by the number of registered residents under 18. The chart separates households with children from those without.

“No one under 18” is the largest category, accounting for 82.2% of the total.

17.8% of addresses have at least one registered resident under 18.

17.8 %with children

With residents under 18

Without residents under 18

Compare with L'Eixample and Barcelona

01/01/2026 · The same period is used for all three areas. Percentage of each area’s total where the source permits calculation; below, the number of households.

Indicator / categoryla Nova Esquerra de l'EixampleL'EixampleBarcelona
No one under 1882.2 %20,775 households82.2 %94,626 households78.6 %538,014 households
One person under 1810.1 %2,551 households10.4 %11,936 households12.1 %82,743 households
Two people under 186.6 %1,678 households6.3 %7,225 households7.4 %50,744 households
Three people under 180.9 %225 households0.9 %1,041 households1.4 %9,886 households
Four or more people under 180.2 %43 households0.2 %247 households0.4 %2,690 households

Municipal register addresses. These figures describe residents, not buyers.

View historical data

01/01/2022 – 01/01/2026 · Most recent first

Category01/01/202601/01/202501/01/202401/01/202301/01/2022
No one under 1820,77520,61520,42920,29120,038
One person under 182,5512,6072,5932,5782,605
Two people under 181,6781,6591,6831,6541,702
Three people under 18225253252272268
Four or more people under 184344434034

Source: Barcelona City Council · OMD · Municipal population register

01/01/2026

Registered households

The number of addresses with registered residents. One address may be home to one or more people; this differs from the total number of homes in the cadastre.

Change from the previous annual edition: +0.4%.

25,272

Compare with L'Eixample and Barcelona

01/01/2026 · The same period is used for all three areas.

Indicator / categoryla Nova Esquerra de l'EixampleL'EixampleBarcelona
Registered households25,272115,075684,077

Municipal register addresses. These figures describe residents, not buyers.

View historical data

01/01/2022 – 01/01/2026 · Most recent first

DateValue
01/01/202625,272
01/01/202525,178
01/01/202425,000
01/01/202324,835
01/01/202224,647

Source: Barcelona City Council · OMD · Municipal population register

2023

Disposable income per resident

Annual disposable income per neighbourhood resident, compared with the district and Barcelona for the same year.

Change from the previous annual edition: +12.2%.

29,218 €

Compare with L'Eixample and Barcelona

2023 · The same period is used for all three areas.

la Nova Esquerra de l'Eixample29,218 €
L'Eixample29,513 €
Barcelona26,069 €

Annual disposable income per resident. This is not a salary or buyers’ budget.

View historical data

2019 – 2023 · Most recent first

DateValue
202329,218 €
202226,033 €
202124,987 €
202023,759 €
201925,405 €

Source: Barcelona City Council · OMD

04 · Neighbourhood history

A brief history of La Nova Esquerra de l’Eixample

Large industrial sites and public facilities shaped a distinctive part of the Eixample.

A neighbourhood of large sites

The Escola Industrial, the former slaughterhouse and La Model shaped the Nova Esquerra’s growth. Factories, institutions and workplaces developed alongside its residential blocks.

Remembering La Model

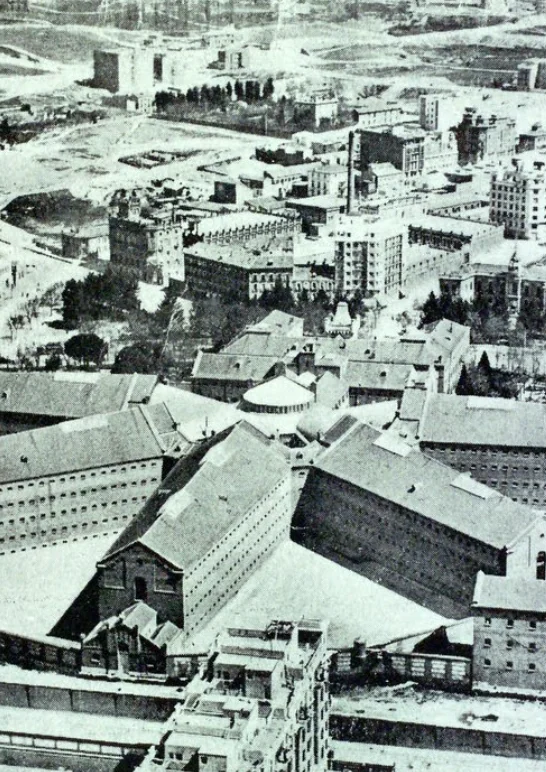
Opened in 1904, La Model was a defining presence in the neighbourhood for more than a century. The historical photograph reveals its grounds and the surroundings of an earlier period. The memory of these large sites offers a view of the Eixample that extends beyond its façades.

La Model and its surroundings in a historical image.

Historical photographs recovered from PUNTO HABITAT’s previous pages. Their dates and authors are not documented in the preserved files.

Ajuntament de Barcelona · Històries de la Nova Esquerra · Ajuntament de Barcelona · La Model

05 · Sources and methodology

What these
figures tell us

A useful comparison starts with understanding what each figure measures. Open the historical tables and read the notes accompanying each indicator.

Are these asking prices or recorded sale prices?

The market section uses averages from recorded transactions, based on notarial statistics published by the City Council. These differ from the asking prices shown on property portals.

Why do the reference dates differ?

Sales, cadastral, population register and income data are released on different schedules. Each section shows its reference period. Viewing this page today does not mean all indicators relate to the same year.

Does the average floor area cover all homes?

The sales section measures the homes that were sold. The housing stock section measures homes recorded in the cadastre. These are different populations, so their averages can differ.

What do “Suppressed” and “Not published” mean?

“Suppressed” means the source withholds the information to protect confidentiality. “Not published” means no value is available for the category and period shown. Neither expression means zero.

Can I value my home using the price per m²?

The neighbourhood average is a general reference. An individual valuation requires an assessment of the exact location, floor area, floor level, lift, natural light, condition and building characteristics, together with suitable comparable properties.

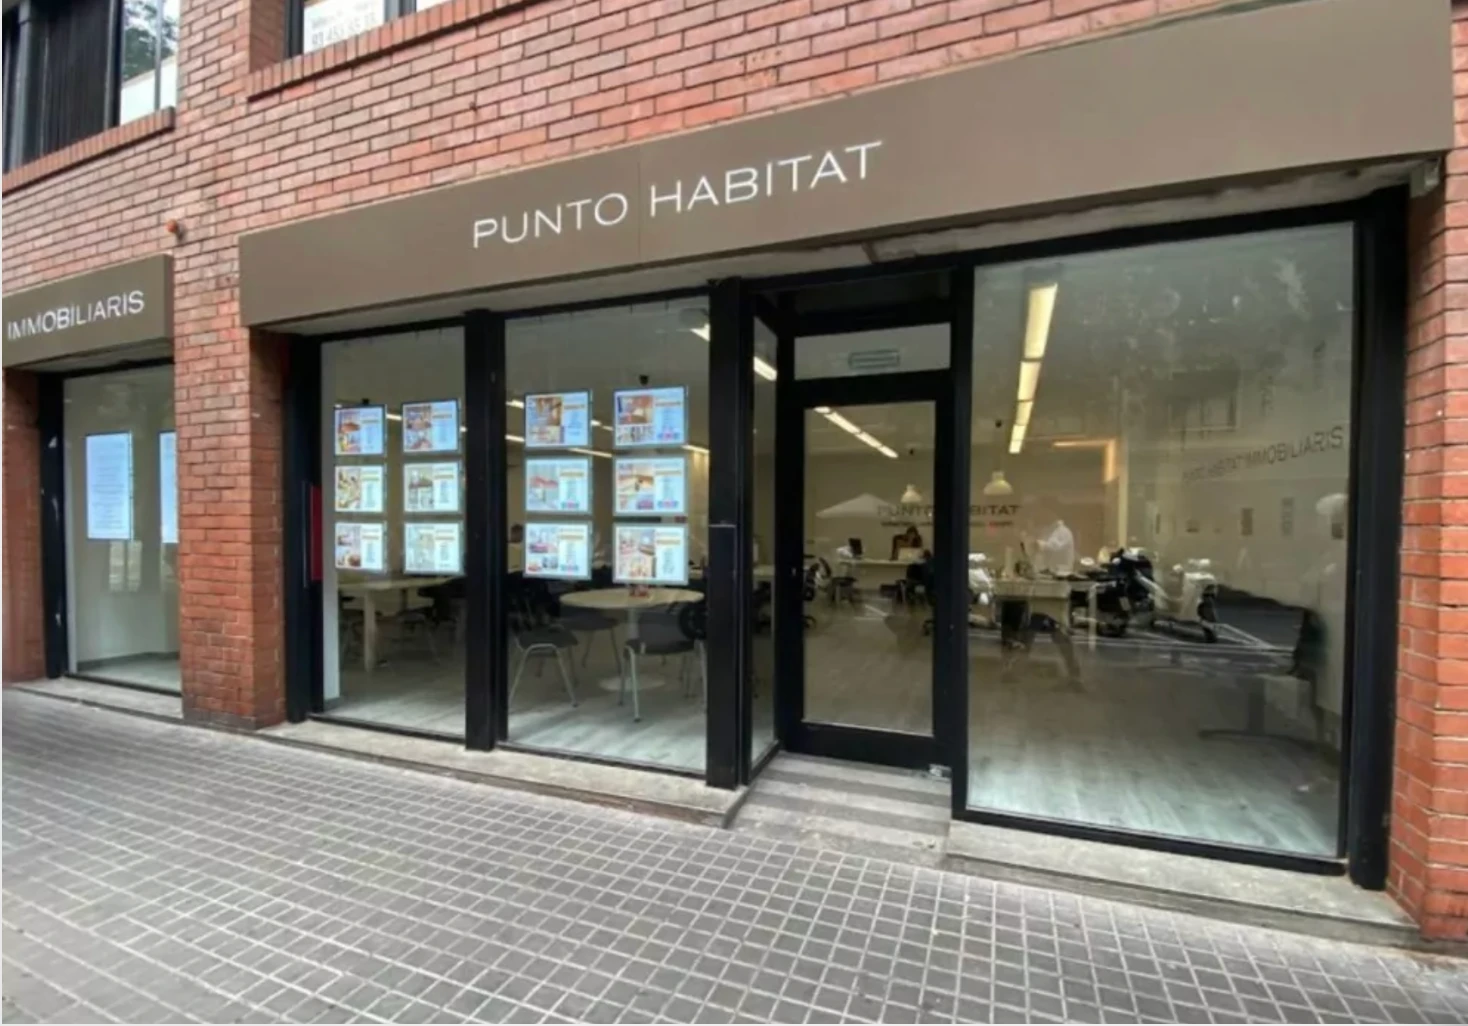
Let’s talk at our offices

You can drop in without an appointment to discuss your property, ask questions and arrange an in-person valuation. We help you sell homes throughout Barcelona.

From the neighbourhood to your home

How much could
your home be worth?

Once you have explored the neighbourhood data, the next step is to look at your own property. Choose how you would like to start.

Compare listings

Compare