Official data from Barcelona City Council. Each figure includes its reference date so you can distinguish the latest available data from the current year.
01 · The housing market
Neighbourhood prices and property sales
Prices paid in recorded transactions, how prices have changed and the ownership of the existing housing stock.
The property sales market
Four key figures for recorded property sales: price per square metre, number of transactions, average purchase price and floor area of homes sold.
Average sale price per m²
4,603 €/m²
2025 · full year
+7.6%compared with the previous year
Residential property sales
349
2025 · full year
-2.5%compared with the previous year
Average price per home
382,139 €
2025 · full year
+3.1%compared with the previous year
Average area of homes sold
86.3 m²
2025 · full year
-4.6%compared with the previous year
Average sale price per m² over time
Recorded property sales · euros per square metre
Scroll the chart to see every year.
Compare with L'Eixample and Barcelona
Each row states its full reference year. The same period is used for all three areas.
Indicator / category
Sant Antoni
L'Eixample
Barcelona
Average sale price per m² 2025 · full year
4,603 €/m²
5,323 €/m²
4,254 €/m²
Residential property sales 2025 · full year
349
2,740
16,897
Average price per home 2025 · full year
382,139 €
516,080 €
372,930 €
Average area of homes sold 2025 · full year
86.3 m²
98.6 m²
86.4 m²
Averages from recorded transactions; these are not individual valuations. The floor area refers to the homes sold.
Source: Barcelona City Council · OMD · Notarial records
2025 · full year
Price by construction period
The average price per square metre of homes sold, grouped by construction period. Figures relate to the stated year, rather than an average across the historical series. Open the historical table to follow each group over time.
1900–19194,696 €/m²
1920–19394,866 €/m²
1940–19594,798 €/m²
1960–19794,490 €/m²
1980–19994,031 €/m²
2000–20204,620 €/m²
Before 19004,735 €/m²
Not recorded4,350 €/m²
Compare with L'Eixample and Barcelona
2025 · full year · The same period is used for all three areas.
Indicator / category
Sant Antoni
L'Eixample
Barcelona
2020–present
Not published
7,872 €/m²
5,731 €/m²
2000–2020
4,620 €/m²
6,320 €/m²
4,904 €/m²
1980–1999
4,031 €/m²
5,217 €/m²
4,373 €/m²
1960–1979
4,490 €/m²
4,968 €/m²
3,944 €/m²
1940–1959
4,798 €/m²
4,836 €/m²
4,105 €/m²
1920–1939
4,866 €/m²
5,355 €/m²
4,772 €/m²
1900–1919
4,696 €/m²
5,486 €/m²
4,640 €/m²
Before 1900
4,735 €/m²
5,833 €/m²
4,308 €/m²
Not recorded
4,350 €/m²
4,706 €/m²
4,278 €/m²
Average sales with at least five observations, restricted to horizontal property. Differences do not isolate the effect of age and are not individual valuations.
View historical data
2021 · full year – 2025 · full year · Most recent first
Category
2025 · full year
2024 · full year
2023 · full year
2022 · full year
2021 · full year
2020–present
Not published
Not published
5,254 €/m²
Not published
Not published
2000–2020
4,620 €/m²
Not published
5,123 €/m²
Not published
4,180 €/m²
1980–1999
4,031 €/m²
4,524 €/m²
3,870 €/m²
4,318 €/m²
3,640 €/m²
1960–1979
4,490 €/m²
4,187 €/m²
4,144 €/m²
3,734 €/m²
3,695 €/m²
1940–1959
4,798 €/m²
3,495 €/m²
3,507 €/m²
3,480 €/m²
3,440 €/m²
1920–1939
4,866 €/m²
4,660 €/m²
3,978 €/m²
3,859 €/m²
3,839 €/m²
1900–1919
4,696 €/m²
4,638 €/m²
4,786 €/m²
3,742 €/m²
3,902 €/m²
Before 1900
4,735 €/m²
3,801 €/m²
3,955 €/m²
6,587 €/m²
3,953 €/m²
Not recorded
4,350 €/m²
4,072 €/m²
4,366 €/m²
3,642 €/m²
4,188 €/m²
Source: Barcelona City Council · OMD
09/03/2026
Registered ownership
The distribution of homes by their first registered cadastral holder: individuals, companies, public bodies and other entities.
“Individual — Spanish nationality” is the largest category, accounting for 76.9% of the total.
83.0 %
of homes have an individual as their first registered cadastral holder.
Compare with L'Eixample and Barcelona
09/03/2026 · The same period is used for all three areas. Percentage of each area’s total where the source permits calculation; below, the number of homes.
Indicator / category
Sant Antoni
L'Eixample
Barcelona
Individual — Spanish nationality
76.9 %15,530 homes
73.4 %107,044 homes
78.8 %659,066 homes
Individual — foreign nationality
6.1 %1,237 homes
6.3 %9,250 homes
5.6 %47,005 homes
Public limited company
3.2 %652 homes
3.5 %5,032 homes
2.1 %17,525 homes
Limited liability / civil company
11.0 %2,229 homes
13.9 %20,215 homes
10.0 %83,338 homes
Other companies and associations
1.3 %265 homes
1.6 %2,344 homes
1.0 %8,237 homes
Foreign entities
0.0 %5 homes
0.1 %138 homes
0.1 %691 homes
Public bodies
0.7 %150 homes
0.6 %920 homes
2.0 %16,387 homes
Religious institutions
0.3 %69 homes
0.3 %399 homes
0.2 %1,534 homes
Other types / joint ventures
0.0 %1 homes
0.0 %5 homes
0.0 %123 homes
Not recorded
0.3 %64 homes
0.3 %474 homes
0.3 %2,715 homes
Based on the first cadastral holder; this does not identify large landlords or how each home is used.
View historical data
01/01/2022 – 09/03/2026 · Most recent first
Category
09/03/2026
04/03/2025
26/02/2024
06/03/2023
01/01/2022
Individual — Spanish nationality
15,530
15,651
15,769
15,870
15,893
Individual — foreign nationality
1,237
1,204
1,101
1,033
949
Public limited company
652
641
626
620
637
Limited liability / civil company
2,229
2,184
2,158
2,121
2,124
Other companies and associations
265
256
197
201
182
Foreign entities
5
7
7
7
6
Public bodies
150
149
149
134
133
Religious institutions
69
36
36
40
18
Other types / joint ventures
1
1
2
1
1
Not recorded
64
69
114
120
187
Source: Barcelona City Council · OMD · Cadastre / property tax
The neighbourhood within the Eixample
Compare recorded sale prices across all six neighbourhoods for the same full year. Select a neighbourhood to highlight it.
Sant AntoniLatest annual figure published: 2026 · partial data · 5,103 €/m². This is a provisional reference and is not directly compared with a full year.View study: Sant Antoni
Floor areas, construction periods and the number of homes. A picture of the housing stock that puts your own property in context.
09/03/2026
How does your home compare in size?
Compare your home’s floor area with the sizes found in the neighbourhood and see what share each range represents.
“61–90 m²” is the largest category, accounting for 49.0% of the total.
<30 m²1.9 %392 homes
31–60 m²19.8 %4,003 homes
61–90 m²49.0 %9,891 homes
91–120 m²22.3 %4,501 homes
121–150 m²5.1 %1,036 homes
151–210 m²1.5 %306 homes
211–250 m²0.2 %36 homes
>250 m²0.2 %37 homes
Compare with L'Eixample and Barcelona
09/03/2026 · The same period is used for all three areas. Percentage of each area’s total where the source permits calculation; below, the number of homes.
Indicator / category
Sant Antoni
L'Eixample
Barcelona
<30 m²
1.9 %392 homes
1.7 %2,544 homes
3.0 %25,014 homes
31–60 m²
19.8 %4,003 homes
17.4 %25,396 homes
27.2 %227,392 homes
61–90 m²
49.0 %9,891 homes
43.9 %64,036 homes
46.0 %384,437 homes
91–120 m²
22.3 %4,501 homes
23.6 %34,434 homes
15.6 %130,240 homes
121–150 m²
5.1 %1,036 homes
7.2 %10,453 homes
4.4 %36,538 homes
151–210 m²
1.5 %306 homes
4.6 %6,697 homes
2.9 %24,203 homes
211–250 m²
0.2 %36 homes
0.9 %1,296 homes
0.6 %4,719 homes
>250 m²
0.2 %37 homes
0.7 %965 homes
0.5 %4,078 homes
Existing cadastral housing stock; these are not current listings.
View historical data
01/01/2022 – 09/03/2026 · Most recent first
Category
09/03/2026
04/03/2025
26/02/2024
06/03/2023
01/01/2022
<30 m²
392
393
390
387
385
31–60 m²
4,003
4,002
3,993
3,983
3,985
61–90 m²
9,891
9,887
9,870
9,884
9,877
91–120 m²
4,501
4,499
4,492
4,474
4,459
121–150 m²
1,036
1,037
1,038
1,037
1,034
151–210 m²
306
307
306
312
321
211–250 m²
36
36
31
31
29
>250 m²
37
37
39
39
40
Source: Barcelona City Council · OMD · Cadastre / property tax
09/03/2026
When the homes were built
See how homes are distributed by construction year and which periods account for the largest share of the housing stock.
“1901–1940” is the largest category, accounting for 24.4% of the total.
Percentage above each bar · Number of homes below each period
22.6 %
<19014,570
24.4 %
1901–19404,920
2.9 %
1941–1950589
5.2 %
1951–19601,043
17.9 %
1961–19703,624
18.0 %
1971–19803,635
3.2 %
1981–1990652
2.4 %
1991–2000488
2.6 %
2001–2010519
0.6 %
2011–2020115
0.2 %
2021–203047
Scroll the chart to see every period.Compare with L'Eixample and Barcelona
09/03/2026 · The same period is used for all three areas. Percentage of each area’s total where the source permits calculation; below, the number of homes.
Indicator / category
Sant Antoni
L'Eixample
Barcelona
<1901
22.6 %4,570 homes
14.8 %21,511 homes
9.5 %79,125 homes
1901–1940
24.4 %4,920 homes
27.1 %39,553 homes
14.2 %118,546 homes
1941–1950
2.9 %589 homes
3.5 %5,114 homes
3.0 %24,697 homes
1951–1960
5.2 %1,043 homes
6.5 %9,414 homes
9.4 %78,578 homes
1961–1970
17.9 %3,624 homes
17.1 %24,982 homes
24.9 %208,397 homes
1971–1980
18.0 %3,635 homes
17.3 %25,173 homes
20.6 %171,941 homes
1981–1990
3.2 %652 homes
4.7 %6,882 homes
4.7 %39,394 homes
1991–2000
2.4 %488 homes
3.5 %5,077 homes
5.0 %41,970 homes
2001–2010
2.6 %519 homes
3.1 %4,489 homes
5.6 %46,677 homes
2011–2020
0.6 %115 homes
1.5 %2,177 homes
2.0 %16,530 homes
2021–2030
0.2 %47 homes
1.0 %1,449 homes
1.3 %10,766 homes
Building age does not indicate condition or renovation history.
View historical data
01/01/2022 – 09/03/2026 · Most recent first
Category
09/03/2026
04/03/2025
26/02/2024
06/03/2023
01/01/2022
<1901
4,570
4,581
4,583
4,586
4,597
1901–1940
4,920
4,922
4,923
4,925
4,919
1941–1950
589
589
575
575
575
1951–1960
1,043
1,042
1,033
1,031
1,032
1961–1970
3,624
3,624
3,622
3,619
3,619
1971–1980
3,635
3,635
3,631
3,632
3,632
1981–1990
652
652
652
652
652
1991–2000
488
488
486
487
487
2001–2010
519
519
519
516
516
2011–2020
115
111
102
98
96
2021–2030
47
35
33
26
5
Source: Barcelona City Council · OMD · Cadastre / property tax
09/03/2026
Average size of existing homes
The average floor area of homes in the cadastre, compared with the district and Barcelona as a whole.
The change from the previous annual edition is below 0.1%.
80.3 m²
Compare with L'Eixample and Barcelona
09/03/2026 · The same period is used for all three areas.
Sant Antoni80.3 m²
L'Eixample88.2 m²
Barcelona77.9 m²
Existing cadastral housing stock; these are not current listings.
View historical data
01/01/2022 – 09/03/2026 · Most recent first
Date
Value
09/03/2026
80.3 m²
04/03/2025
80.3 m²
26/02/2024
80.3 m²
06/03/2023
80.3 m²
01/01/2022
80.3 m²
Source: Barcelona City Council · OMD · Cadastre / property tax
09/03/2026
Average age of homes
The average age of the housing stock, calculated from construction years. Compare the neighbourhood with its district and the city.
Change from the previous annual edition: +1.1%.
82.5 years
Compare with L'Eixample and Barcelona
09/03/2026 · The same period is used for all three areas.
Sant Antoni82.5 years
L'Eixample76.6 years
Barcelona66.5 years
Building age does not indicate condition or renovation history.
View historical data
01/01/2022 – 09/03/2026 · Most recent first
Date
Value
09/03/2026
82.5 years
04/03/2025
81.6 years
26/02/2024
80.6 years
06/03/2023
79.7 years
01/01/2022
78.8 years
Source: Barcelona City Council · OMD · Cadastre / property tax
09/03/2026
Homes in the neighbourhood
The number of homes recorded in the cadastre. Explore the trend and compare it with totals for the district and Barcelona.
The change from the previous annual edition is below 0.1%.
20,202
Compare with L'Eixample and Barcelona
09/03/2026 · The same period is used for all three areas.
Indicator / category
Sant Antoni
L'Eixample
Barcelona
Homes in the neighbourhood
20,202
145,821
836,621
Existing cadastral housing stock; these are not current listings.
View historical data
01/01/2022 – 09/03/2026 · Most recent first
Date
Value
09/03/2026
20,202
04/03/2025
20,198
26/02/2024
20,159
06/03/2023
20,147
01/01/2022
20,130
Source: Barcelona City Council · OMD · Cadastre / property tax
03 · Life in the neighbourhood
Households, residents and disposable income
Household composition and residents’ economic context, with comparisons between areas where the data allow.
01/01/2026
People registered at each address
The distribution of neighbourhood households by the number of people registered at each address.
“One person” is the largest category, accounting for 34.4% of the total.
One person34.4 %5,645 households
Two people29.9 %4,908 households
Three people16.9 %2,763 households
Four people10.8 %1,764 households
Five people3.8 %627 households
Six people1.8 %301 households
Seven people1.1 %177 households
Eight people0.5 %84 households
Nine or more people0.7 %121 households
Compare with L'Eixample and Barcelona
01/01/2026 · The same period is used for all three areas. Percentage of each area’s total where the source permits calculation; below, the number of households.
Indicator / category
Sant Antoni
L'Eixample
Barcelona
One person
34.4 %5,645 households
34.2 %39,345 households
31.9 %218,433 households
Two people
29.9 %4,908 households
30.0 %34,566 households
29.5 %201,690 households
Three people
16.9 %2,763 households
16.9 %19,456 households
17.6 %120,498 households
Four people
10.8 %1,764 households
11.6 %13,308 households
12.7 %86,631 households
Five people
3.8 %627 households
3.9 %4,476 households
4.4 %30,379 households
Six people
1.8 %301 households
1.6 %1,872 households
1.8 %12,508 households
Seven people
1.1 %177 households
0.8 %896 households
0.9 %6,005 households
Eight people
0.5 %84 households
0.4 %472 households
0.5 %3,256 households
Nine or more people
0.7 %121 households
0.6 %684 households
0.7 %4,677 households
Municipal register addresses. These figures describe residents, not buyers.
View historical data
01/01/2022 – 01/01/2026 · Most recent first
Category
01/01/2026
01/01/2025
01/01/2024
01/01/2023
01/01/2022
One person
5,645
5,585
5,608
5,608
5,546
Two people
4,908
4,945
4,951
4,934
4,914
Three people
2,763
2,740
2,741
2,736
2,762
Four people
1,764
1,866
1,881
1,865
1,850
Five people
627
605
600
631
618
Six people
301
303
281
252
247
Seven people
177
163
140
144
145
Eight people
84
82
84
60
71
Nine or more people
121
127
98
92
94
Source: Barcelona City Council · OMD · Municipal population register
01/01/2026
Children registered at each address
The distribution of households by the number of registered residents under 18. The chart separates households with children from those without.
“No one under 18” is the largest category, accounting for 82.4% of the total.
17.6% of addresses have at least one registered resident under 18.
17.6 %with children
With residents under 18
Without residents under 18
Compare with L'Eixample and Barcelona
01/01/2026 · The same period is used for all three areas. Percentage of each area’s total where the source permits calculation; below, the number of households.
Indicator / category
Sant Antoni
L'Eixample
Barcelona
No one under 18
82.4 %13,502 households
82.2 %94,626 households
78.6 %538,014 households
One person under 18
10.4 %1,709 households
10.4 %11,936 households
12.1 %82,743 households
Two people under 18
6.0 %991 households
6.3 %7,225 households
7.4 %50,744 households
Three people under 18
0.9 %146 households
0.9 %1,041 households
1.4 %9,886 households
Four or more people under 18
0.3 %42 households
0.2 %247 households
0.4 %2,690 households
Municipal register addresses. These figures describe residents, not buyers.
View historical data
01/01/2022 – 01/01/2026 · Most recent first
Category
01/01/2026
01/01/2025
01/01/2024
01/01/2023
01/01/2022
No one under 18
13,502
13,476
13,441
13,341
13,269
One person under 18
1,709
1,729
1,722
1,732
1,723
Two people under 18
991
1,015
1,022
1,034
1,042
Three people under 18
146
154
153
171
154
Four or more people under 18
42
42
46
44
59
Source: Barcelona City Council · OMD · Municipal population register
01/01/2026
Registered households
The number of addresses with registered residents. One address may be home to one or more people; this differs from the total number of homes in the cadastre.
Change from the previous annual edition: -0.2%.
16,390
Compare with L'Eixample and Barcelona
01/01/2026 · The same period is used for all three areas.
Indicator / category
Sant Antoni
L'Eixample
Barcelona
Registered households
16,390
115,075
684,077
Municipal register addresses. These figures describe residents, not buyers.
View historical data
01/01/2022 – 01/01/2026 · Most recent first
Date
Value
01/01/2026
16,390
01/01/2025
16,416
01/01/2024
16,384
01/01/2023
16,322
01/01/2022
16,247
Source: Barcelona City Council · OMD · Municipal population register
2023
Disposable income per resident
Annual disposable income per neighbourhood resident, compared with the district and Barcelona for the same year.
Change from the previous annual edition: +12.3%.
26,660 €
Compare with L'Eixample and Barcelona
2023 · The same period is used for all three areas.
Sant Antoni26,660 €
L'Eixample29,513 €
Barcelona26,069 €
Annual disposable income per resident. This is not a salary or buyers’ budget.
View historical data
2019 – 2023 · Most recent first
Date
Value
2023
26,660 €
2022
23,745 €
2021
22,585 €
2020
21,219 €
2019
22,949 €
Source: Barcelona City Council · OMD
04 · Neighbourhood history
A brief history of Sant Antoni
The market and local commerce are two threads running through Sant Antoni’s history.
A market beyond the walls
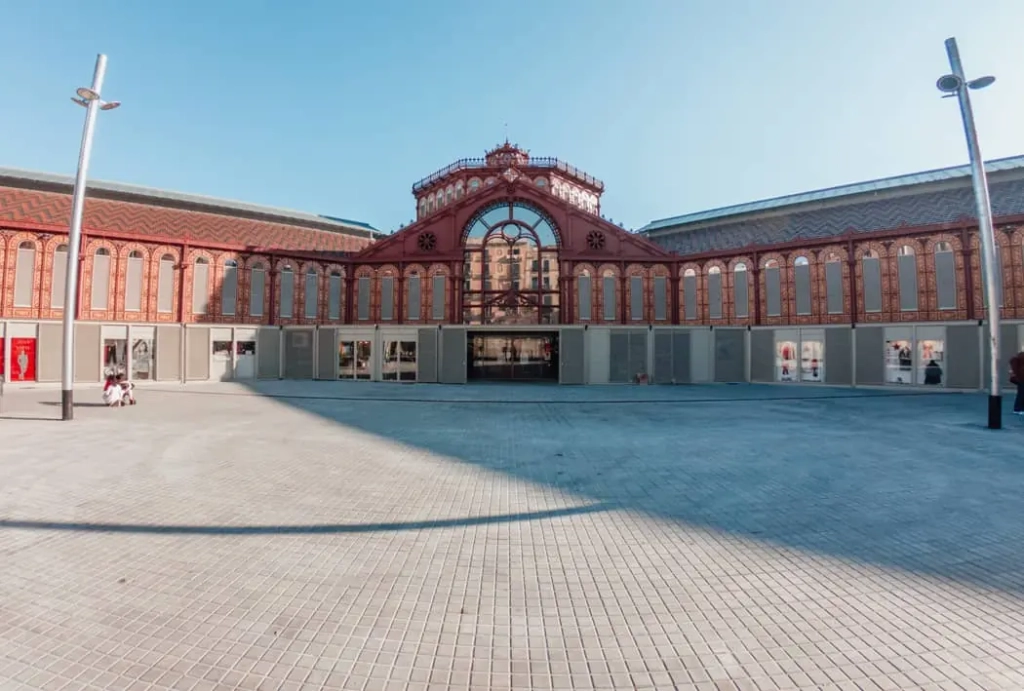
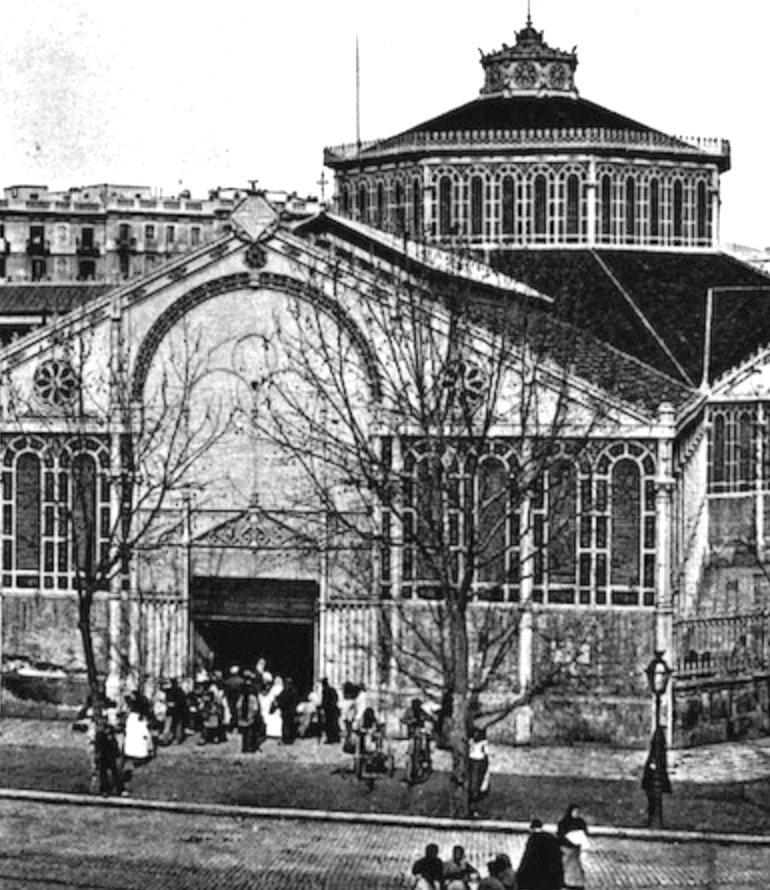
Sant Antoni Market, opened in 1882 and designed by Antoni Rovira i Trias, accompanied Barcelona’s expansion beyond its walls. Its iron structure became a landmark in the new neighbourhood.
Commerce and everyday life
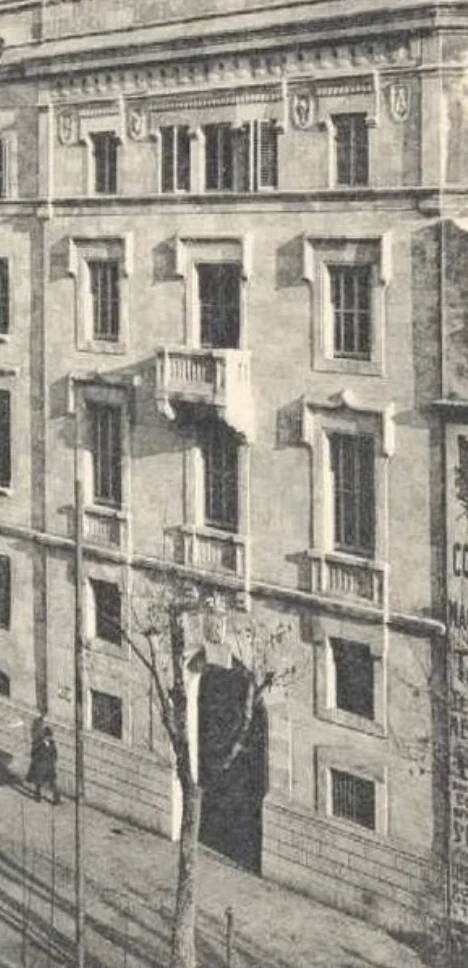
Food stalls, the Encants and the Sunday book market brought different activities together around one building. The old photographs offer a glimpse of this commercial setting and the buildings that gradually shaped Sant Antoni.
A Sant Antoni building in an old photograph.Sant Antoni Market in an earlier period.
Historical photographs recovered from PUNTO HABITAT’s previous pages. Their dates and authors are not documented in the preserved files.
A useful comparison starts with understanding what each figure measures. Open the historical tables and read the notes accompanying each indicator.
Are these asking prices or recorded sale prices?
The market section uses averages from recorded transactions, based on notarial statistics published by the City Council. These differ from the asking prices shown on property portals.
Why do the reference dates differ?
Sales, cadastral, population register and income data are released on different schedules. Each section shows its reference period. Viewing this page today does not mean all indicators relate to the same year.
Does the average floor area cover all homes?
The sales section measures the homes that were sold. The housing stock section measures homes recorded in the cadastre. These are different populations, so their averages can differ.
What do “Suppressed” and “Not published” mean?
“Suppressed” means the source withholds the information to protect confidentiality. “Not published” means no value is available for the category and period shown. Neither expression means zero.
Can I value my home using the price per m²?
The neighbourhood average is a general reference. An individual valuation requires an assessment of the exact location, floor area, floor level, lift, natural light, condition and building characteristics, together with suitable comparable properties.
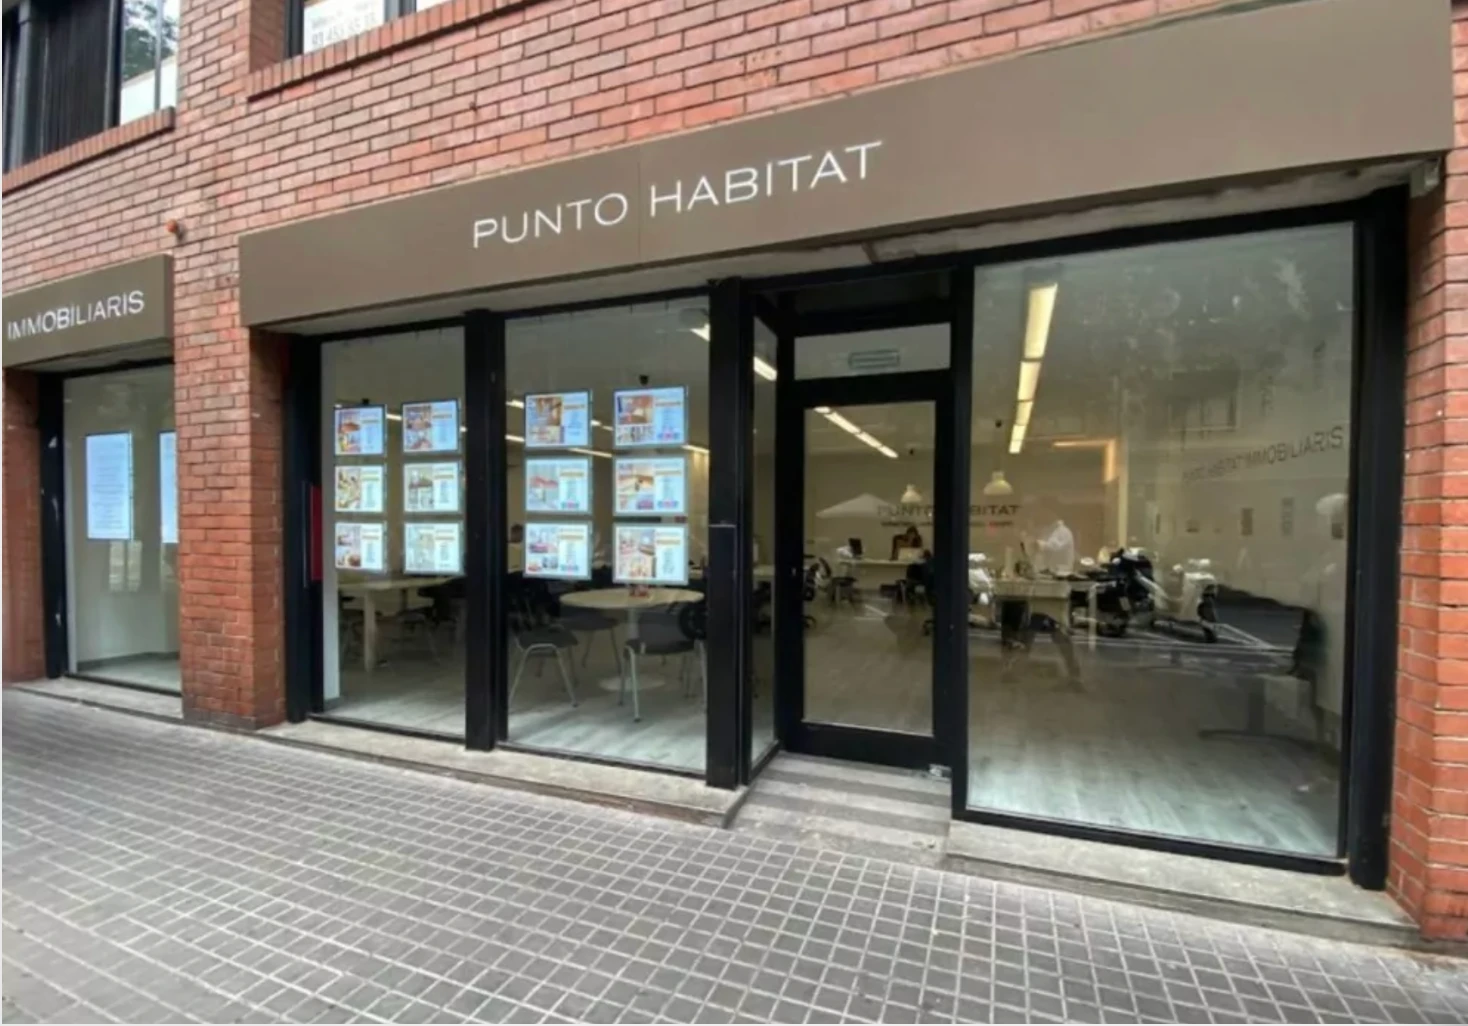
You can drop in without an appointment to discuss your property, ask questions and arrange an in-person valuation. We help you sell homes throughout Barcelona.
Espai Sant Joan
PUNTO HABITAT Passeig de Sant Joan, 150 · Barcelona 93 539 14 10
Please enter your username or email address. You will receive a link to create a new password via email.
Gestionar el consentimiento de las cookies
Para ofrecer las mejores experiencias, utilizamos tecnologías como las cookies para almacenar y/o acceder a la información del dispositivo. El consentimiento de estas tecnologías nos permitirá procesar datos como el comportamiento de navegación o las identificaciones únicas en este sitio. No consentir o retirar el consentimiento, puede afectar negativamente a ciertas características y funciones.
Funcional
Always active
El almacenamiento o acceso técnico es estrictamente necesario para el propósito legítimo de permitir el uso de un servicio específico explícitamente solicitado por el abonado o usuario, o con el único propósito de llevar a cabo la transmisión de una comunicación a través de una red de comunicaciones electrónicas.
Preferencias
El almacenamiento o acceso técnico es necesario para la finalidad legítima de almacenar preferencias no solicitadas por el abonado o usuario.
Estadísticas
El almacenamiento o acceso técnico que es utilizado exclusivamente con fines estadísticos.El almacenamiento o acceso técnico que se utiliza exclusivamente con fines estadísticos anónimos. Sin un requerimiento, el cumplimiento voluntario por parte de tu proveedor de servicios de Internet, o los registros adicionales de un tercero, la información almacenada o recuperada sólo para este propósito no se puede utilizar para identificarte.
Marketing
El almacenamiento o acceso técnico es necesario para crear perfiles de usuario para enviar publicidad, o para rastrear al usuario en una web o en varias web con fines de marketing similares.