


Average price per m²
4,579 €/m²
2026 · partial data
Last full year: 4,254 €/m²
2025 · full year

BARCELONA · THE HOUSING MARKET
Districts, neighbourhoods and trends
Latest property price · 2026 · provisional data
4,579 €/m²Explore the prices ↓The average property sale price in Barcelona is 4,579 €/m², according to provisional 2026 figures published by Barcelona City Council. This average covers recorded transactions from an incomplete year; the value of an individual home depends on its characteristics.
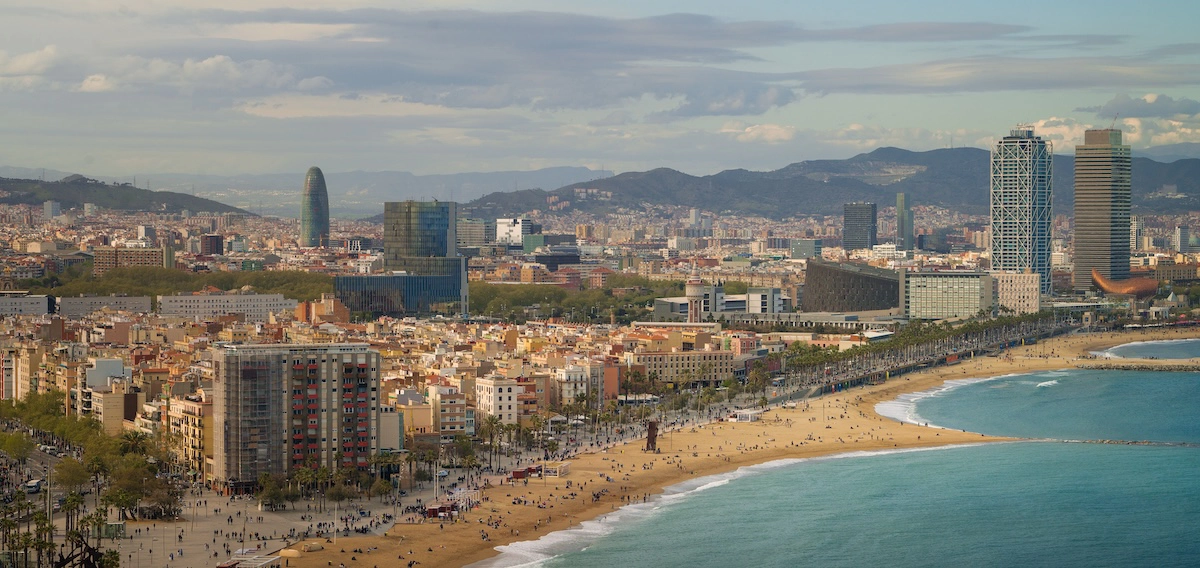
The main figures, map and neighbourhood table highlight 2026 prices and label provisional data. The chart retains ten full years so that comparable periods are shown.
The latest available 2026 figures, with their reference periods. Below each figure, 2025 provides the last full-year reference.
4,579 €/m²
2026 · partial data
Last full year: 4,254 €/m²
2025 · full year
383,109 €
2026 · partial data
Last full year: 372,930 €
2025 · full year
12,402
2026 · partial data
Last full year: 16,897
2025 · full year
82.8 m²
2026 · partial data
Last full year: 86.4 m²
2025 · full year
Source: Barcelona City Council · OMD · notarial statistics · CC BY 4.0
A decade of average prices per square metre. Each newly published complete year enters the chart and replaces the oldest, keeping a ten-year window.
2016–2025 · full year
On mobile, scroll the chart; the table contains the same figures.
| Year | Price per m² | Annual change |
|---|---|---|
| 2016 | 2,714 €/m² | +4.1% |
| 2017 | 3,145 €/m² | +15.9% |
| 2018 | 3,382 €/m² | +7.5% |
| 2019 | 3,306 €/m² | -2.2% |
| 2020 | 3,296 €/m² | -0.3% |
| 2021 | 3,328 €/m² | +1.0% |
| 2022 | 3,597 €/m² | +8.1% |
| 2023 | 3,622 €/m² | +0.7% |
| 2024 | 3,874 €/m² | +7.0% |
| 2025 | 4,254 €/m² | +9.8% |
Explore the latest available 2026 prices. Select a district to see its neighbourhoods. Darker shades indicate a higher average price.
2026 · provisional data · €/m²
All districts
View neighbourhoods in this district ↓Explore all 73 neighbourhoods, grouped by district. The first price column shows 2026; the next retains the last full year for reference.
73 neighbourhoods shown · 2026 · provisional data
| Neighbourhood | District | Price per m² 2026 · provisional data | Price per m² 2025 · full year |
|---|---|---|---|
| District · Ciutat Vella | |||
| El Raval → | Ciutat Vella | 3,769 €/m² | 3,499 €/m² |
| El Barri Gòtic → | Ciutat Vella | 4,531 €/m² | 4,386 €/m² |
| La Barceloneta → | Ciutat Vella | 5,303 €/m² | 5,183 €/m² |
| Sant Pere, Santa Caterina i la Ribera → | Ciutat Vella | 4,897 €/m² | 4,455 €/m² |
| District · Eixample | |||
| El Fort Pienc → | Eixample | 4,244 €/m² | 4,806 €/m² |
| La Sagrada Família → | Eixample | 5,197 €/m² | 4,766 €/m² |
| La Dreta de l'Eixample → | Eixample | 6,492 €/m² | 6,224 €/m² |
| L'Antiga Esquerra de l'Eixample → | Eixample | 6,119 €/m² | 5,849 €/m² |
| La Nova Esquerra de l'Eixample → | Eixample | 5,304 €/m² | 5,211 €/m² |
| Sant Antoni → | Eixample | 5,103 €/m² | 4,603 €/m² |
| District · Sants-Montjuïc | |||
| El Poble-sec → | Sants-Montjuïc | 4,430 €/m² | 4,013 €/m² |
| La Marina del Prat Vermell → | Sants-Montjuïc | 2,650 €/m² | 2,724 €/m² |
| La Marina de Port → | Sants-Montjuïc | 3,674 €/m² | 2,936 €/m² |
| La Font de la Guatlla → | Sants-Montjuïc | 4,273 €/m² | 4,039 €/m² |
| Hostafrancs → | Sants-Montjuïc | 4,780 €/m² | 4,041 €/m² |
| La Bordeta → | Sants-Montjuïc | 4,316 €/m² | 3,855 €/m² |
| Sants - Badal → | Sants-Montjuïc | 4,450 €/m² | 3,958 €/m² |
| Sants → | Sants-Montjuïc | 4,673 €/m² | 4,310 €/m² |
| District · Les Corts | |||
| Les Corts → | Les Corts | 5,765 €/m² | 5,162 €/m² |
| La Maternitat i Sant Ramon → | Les Corts | 5,142 €/m² | 4,399 €/m² |
| Pedralbes → | Les Corts | 7,167 €/m² | 6,079 €/m² |
| District · Sarrià-Sant Gervasi | |||
| Vallvidrera, el Tibidabo i les Planes → | Sarrià-Sant Gervasi | 3,958 €/m² | 3,766 €/m² |
| Sarrià → | Sarrià-Sant Gervasi | 6,951 €/m² | 6,294 €/m² |
| Les Tres Torres → | Sarrià-Sant Gervasi | 6,744 €/m² | 5,743 €/m² |
| Sant Gervasi - la Bonanova → | Sarrià-Sant Gervasi | 6,081 €/m² | 5,438 €/m² |
| Sant Gervasi - Galvany → | Sarrià-Sant Gervasi | 6,725 €/m² | 5,957 €/m² |
| El Putxet i el Farró → | Sarrià-Sant Gervasi | 5,761 €/m² | 4,799 €/m² |
| District · Gràcia | |||
| Vallcarca i els Penitents → | Gràcia | 4,777 €/m² | 4,152 €/m² |
| El Coll → | Gràcia | 3,471 €/m² | 3,558 €/m² |
| La Salut → | Gràcia | 2,849 €/m² | 4,487 €/m² |
| La Vila de Gràcia → | Gràcia | 5,705 €/m² | 5,094 €/m² |
| El Camp d'en Grassot i Gràcia Nova → | Gràcia | 5,276 €/m² | 5,031 €/m² |
| District · Horta-Guinardó | |||
| El Baix Guinardó → | Horta-Guinardó | 4,567 €/m² | 4,160 €/m² |
| Can Baró → | Horta-Guinardó | 3,901 €/m² | 3,405 €/m² |
| El Guinardó → | Horta-Guinardó | 4,467 €/m² | 3,897 €/m² |
| La Font d'en Fargues → | Horta-Guinardó | 3,837 €/m² | 4,013 €/m² |
| El Carmel → | Horta-Guinardó | 3,156 €/m² | 2,858 €/m² |
| La Teixonera → | Horta-Guinardó | 3,467 €/m² | 2,951 €/m² |
| Sant Genís dels Agudells → | Horta-Guinardó | 3,076 €/m² | 2,456 €/m² |
| Montbau → | Horta-Guinardó | 3,483 €/m² | 3,138 €/m² |
| La Vall d'Hebron → | Horta-Guinardó | 4,775 €/m² | 3,866 €/m² |
| La Clota → | Horta-Guinardó | No data | 4,668 €/m² |
| Horta → | Horta-Guinardó | 3,723 €/m² | 3,328 €/m² |
| District · Nou Barris | |||
| Vilapicina i la Torre Llobeta → | Nou Barris | 3,733 €/m² | 3,569 €/m² |
| Porta → | Nou Barris | 3,971 €/m² | 3,338 €/m² |
| El Turó de la Peira → | Nou Barris | 3,254 €/m² | 2,982 €/m² |
| Can Peguera → | Nou Barris | No data | No data |
| La Guineueta → | Nou Barris | 3,209 €/m² | 3,113 €/m² |
| Canyelles → | Nou Barris | 2,864 €/m² | 2,533 €/m² |
| Les Roquetes → | Nou Barris | 3,048 €/m² | 2,465 €/m² |
| Verdun → | Nou Barris | 3,433 €/m² | 2,736 €/m² |
| La Prosperitat → | Nou Barris | 3,488 €/m² | 3,159 €/m² |
| La Trinitat Nova → | Nou Barris | 2,546 €/m² | 2,505 €/m² |
| Torre Baró → | Nou Barris | No data | 1,739 €/m² |
| Ciutat Meridiana → | Nou Barris | 2,382 €/m² | 2,660 €/m² |
| Vallbona → | Nou Barris | No data | 1,697 €/m² |
| District · Sant Andreu | |||
| La Trinitat Vella → | Sant Andreu | 2,359 €/m² | 2,206 €/m² |
| Baró de Viver → | Sant Andreu | 2,414 €/m² | 1,801 €/m² |
| El Bon Pastor → | Sant Andreu | 2,544 €/m² | 2,746 €/m² |
| Sant Andreu → | Sant Andreu | 4,460 €/m² | 3,881 €/m² |
| La Sagrera → | Sant Andreu | 4,234 €/m² | 3,662 €/m² |
| El Congrés i els Indians → | Sant Andreu | 3,936 €/m² | 3,729 €/m² |
| Navas → | Sant Andreu | 4,337 €/m² | 4,029 €/m² |
| District · Sant Martí | |||
| El Camp de l'Arpa del Clot → | Sant Martí | 4,462 €/m² | 4,243 €/m² |
| El Clot → | Sant Martí | 4,787 €/m² | 4,092 €/m² |
| El Parc i la Llacuna del Poblenou → | Sant Martí | 5,167 €/m² | 4,704 €/m² |
| La Vila Olímpica del Poblenou → | Sant Martí | 5,890 €/m² | 5,249 €/m² |
| El Poblenou → | Sant Martí | 6,068 €/m² | 5,448 €/m² |
| Diagonal Mar i el Front Marítim del Poblenou → | Sant Martí | 3,848 €/m² | 5,528 €/m² |
| El Besòs i el Maresme → | Sant Martí | 3,359 €/m² | 2,837 €/m² |
| Provençals del Poblenou → | Sant Martí | 4,389 €/m² | 4,234 €/m² |
| Sant Martí de Provençals → | Sant Martí | 3,723 €/m² | 3,304 €/m² |
| La Verneda i la Pau → | Sant Martí | 3,183 €/m² | 2,971 €/m² |
No neighbourhoods match your search.
Provisional and annual figures cover different periods. “Not available” means there is no verified figure for that neighbourhood and year; a different period is not used as a substitute.
Enter your property’s address and characteristics to get an indicative valuation. The neighbourhood’s average price is only a starting point.
The online estimate is indicative and does not replace an official appraisal.
We visit your property to assess its condition, layout, natural light and outdoor spaces. Understanding its individual features helps us refine the guidance provided by the online valuation tool.
Request an in-person valuation →The source, period and characteristics of the transactions matter as much as the figure itself.
These are averages of recorded property sales published by Barcelona City Council using notarial statistics. They are not the prices sellers ask for in property listings.
Not exactly. Price per square metre helps compare properties of different sizes; the average price per home reflects the total value of each transaction. The official residential series can include different property types and is not a sample of identical flats.
We show the latest ten complete years available. When the source publishes a new validated annual total, that year enters the chart and replaces the oldest. Until then, the current year is shown separately as provisional, without estimating unpublished figures.
That gives an initial approximation, not a market valuation. Floor level, a lift, condition, light, outdoor space and other features can significantly change the result. An online estimate and an in-person assessment help refine it.
Barcelona’s figure comes directly from the official city series. We do not calculate a simple average of the ten district prices or the 73 neighbourhood prices.
An average can change because of the number and type of homes sold. In areas with few transactions, individual sales can have a large influence. Read the trend alongside the context of each property.